

A deployment pipeline that ships quickly but cannot tell you whether the new version is healthy is just a faster way to break production. Observability is how you find out what your system is doing from the outside: whether requests succeed, how fast they are, and why they fail. This part sets up logs, metrics, alarms and dashboards for the orders-api service with Amazon CloudWatch, and shows where Prometheus and Grafana fit for the Kubernetes path.
The three signals
Observability rests on three kinds of telemetry, each answering a different question:
- Metrics — numbers over time. Is something wrong? Request count, error rate, latency, CPU, memory.
- Logs — timestamped events with detail. What exactly happened? The stack trace, the request ID, the user action.
- Traces — the path of one request across services. Where did the time go? Which downstream call was slow.
Metrics trigger alarms; logs and traces explain them. A good setup lets you go from an alarm to the failing request's log line in under a minute.
Logs with CloudWatch Logs
In part seven, the task definition's awslogs log driver already ships container stdout and stderr to the /ecs/orders-api log group. Three habits turn raw log lines into something useful:
- Log in JSON. Structured fields (
level,requestId,route,status,durationMs) can be filtered and aggregated; free-text lines can only be searched. - Include a request or correlation ID in every line, and pass it to downstream calls. That one field connects everything a request touched.
- Set a retention period. Log groups keep data forever by default, and storage adds up. Thirty days for application logs is a sensible start; keep audit logs longer.
resource "aws_cloudwatch_log_group" "orders" {
  name              = "/ecs/orders-api"
  retention_in_days = 30
}
Querying with Logs Insights
CloudWatch Logs Insights queries log groups with a purpose-built query language. It is the tool you will open first during an incident. Because our logs are JSON, the fields are discovered automatically:
fields @timestamp, route, status, durationMs, requestId
| filter status >= 500
| stats count(*) as errors, avg(durationMs) as avgMs by route
| sort errors desc
| limit 20
In a few seconds you know which endpoint is failing, how often and how slow it is, and you have request IDs to dig into. Save the queries you use often so the whole team can run them.
Metrics: what to measure
You get many metrics for free: ECS publishes service CPU and memory; the ALB publishes request count, target response time and HTTP status codes; RDS publishes connections and latency. For anything user-facing, organise metrics around the four golden signals:
- Latency — how long requests take. Track a high percentile such as p99, not only the average, because averages hide the slow requests your users notice.
- Traffic — requests per second.
- Errors — the rate of failed requests (5xx from the load balancer and targets).
- Saturation — how full your resources are: CPU, memory, connection pools, queue depth.
Enable Container Insights on the ECS cluster (and on EKS) for task- and pod-level CPU, memory and network metrics, which the default service metrics do not break down.
You can also publish custom metrics from your code, or extract them from logs with metric filters (for example, counting log lines where level = "error"). Use the Embedded Metric Format to emit metrics inside structured log lines without extra API calls.
Alarms that mean something
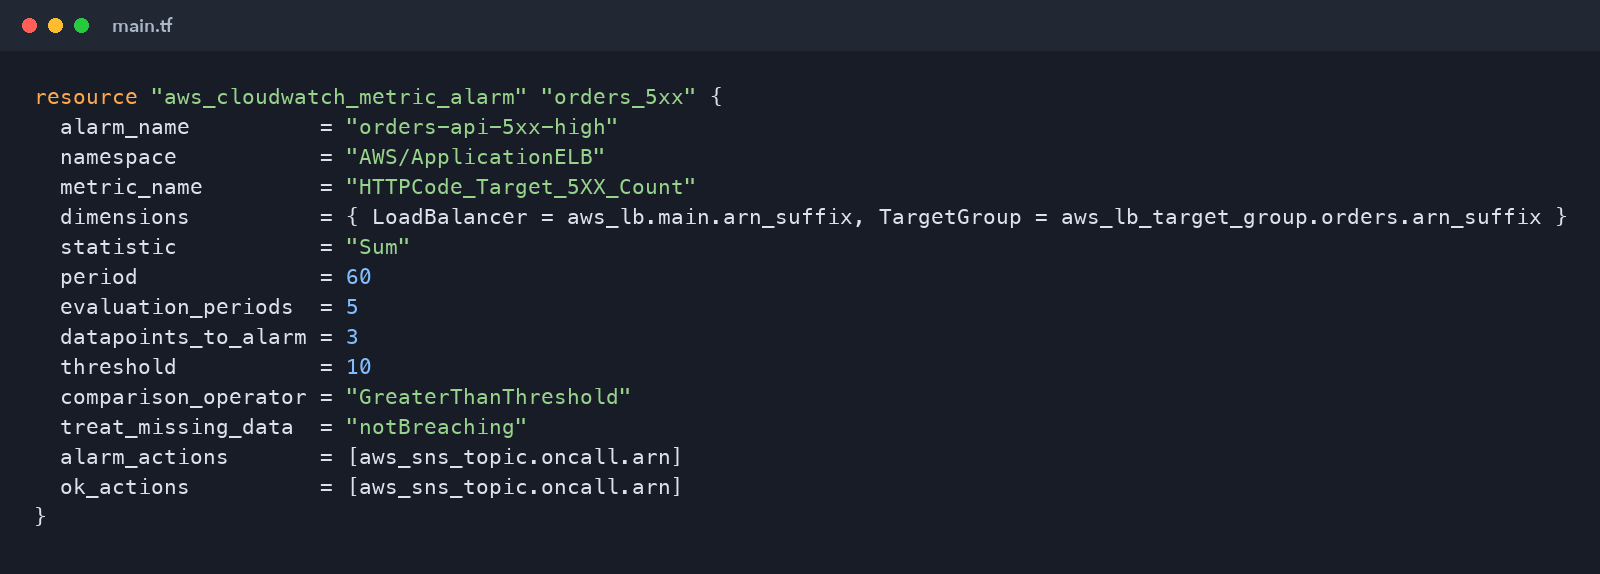
An alarm should fire only when a human needs to act. Alarm on symptoms users feel, not every internal wobble. For our API, two alarms on load-balancer metrics cover most of what matters:
resource "aws_cloudwatch_metric_alarm" "orders_5xx" {
  alarm_name          = "orders-api-5xx-high"
  namespace           = "AWS/ApplicationELB"
  metric_name         = "HTTPCode_Target_5XX_Count"
  dimensions          = { LoadBalancer = aws_lb.main.arn_suffix, TargetGroup = aws_lb_target_group.orders.arn_suffix }
  statistic           = "Sum"
  period              = 60
  evaluation_periods  = 5
  datapoints_to_alarm = 3
  threshold           = 10
  comparison_operator = "GreaterThanThreshold"
  treat_missing_data  = "notBreaching"
  alarm_actions       = [aws_sns_topic.oncall.arn]
  ok_actions          = [aws_sns_topic.oncall.arn]
}
Notice the tuning: the alarm fires when three of the last five minutes each have more than ten errors. A single bad minute does not page anyone; a sustained problem does. Pair it with a latency alarm on TargetResponseTime using the p99 statistic. Route notifications through an SNS topic to email, chat or your incident tool. Keep alarms in Terraform alongside the service they protect, so every new service ships with them.
These same alarms close the loop with deployments. In part ten, the error-rate alarm becomes the trigger for automatic rollback.
Dashboards
A dashboard per service should answer "is it healthy right now?" at a glance: request rate, error rate, p99 latency, task count, CPU and memory, side by side for the same time window. Build it in Terraform with aws_cloudwatch_dashboard, and add deployment markers or annotations so you can see whether a spike lines up with a release.
Traces
When a request crosses several services, logs alone cannot show where the time went. Distributed tracing follows a request end to end. Instrument your application with OpenTelemetry (the vendor-neutral standard) and send traces to AWS X-Ray through the AWS Distro for OpenTelemetry collector. Start by tracing incoming HTTP requests and outgoing database and HTTP calls; that covers most performance questions.
Prometheus and Grafana on EKS
Kubernetes teams usually standardise on the open-source pair:
- Prometheus scrapes metrics from pods and nodes and stores them as time series; you query them with PromQL. Amazon Managed Service for Prometheus runs the storage and querying for you.
- Grafana builds dashboards on top of Prometheus, CloudWatch and many other sources. Amazon Managed Grafana provides it with IAM Identity Center sign-in.
A common setup scrapes cluster and application metrics into managed Prometheus, keeps load-balancer and AWS-service metrics in CloudWatch, and shows both in one Grafana dashboard. You do not have to choose one world.
Audit trail
Observability is also about changes, not just traffic. CloudTrail (enabled in part one) records who called which API and when. When an incident starts at 14:02, checking CloudTrail for changes at 14:00 often finds the cause faster than any metric.
Key takeaways
- Log in structured JSON with a request ID, and set retention on every log group.
- Use Logs Insights for investigation and the four golden signals for metrics.
- Alarm on user-visible symptoms with tuning that avoids noise, and keep alarms in Terraform.
- Add tracing with OpenTelemetry and use Prometheus and Grafana where Kubernetes teams expect them.
What's next
In the final part we bring everything together for production readiness: secrets management, zero-downtime blue/green deployments with automatic rollback, backups, cost control and the checklist to run before going live.
Comments (0)
No comments yet — be the first to share your thoughts.